



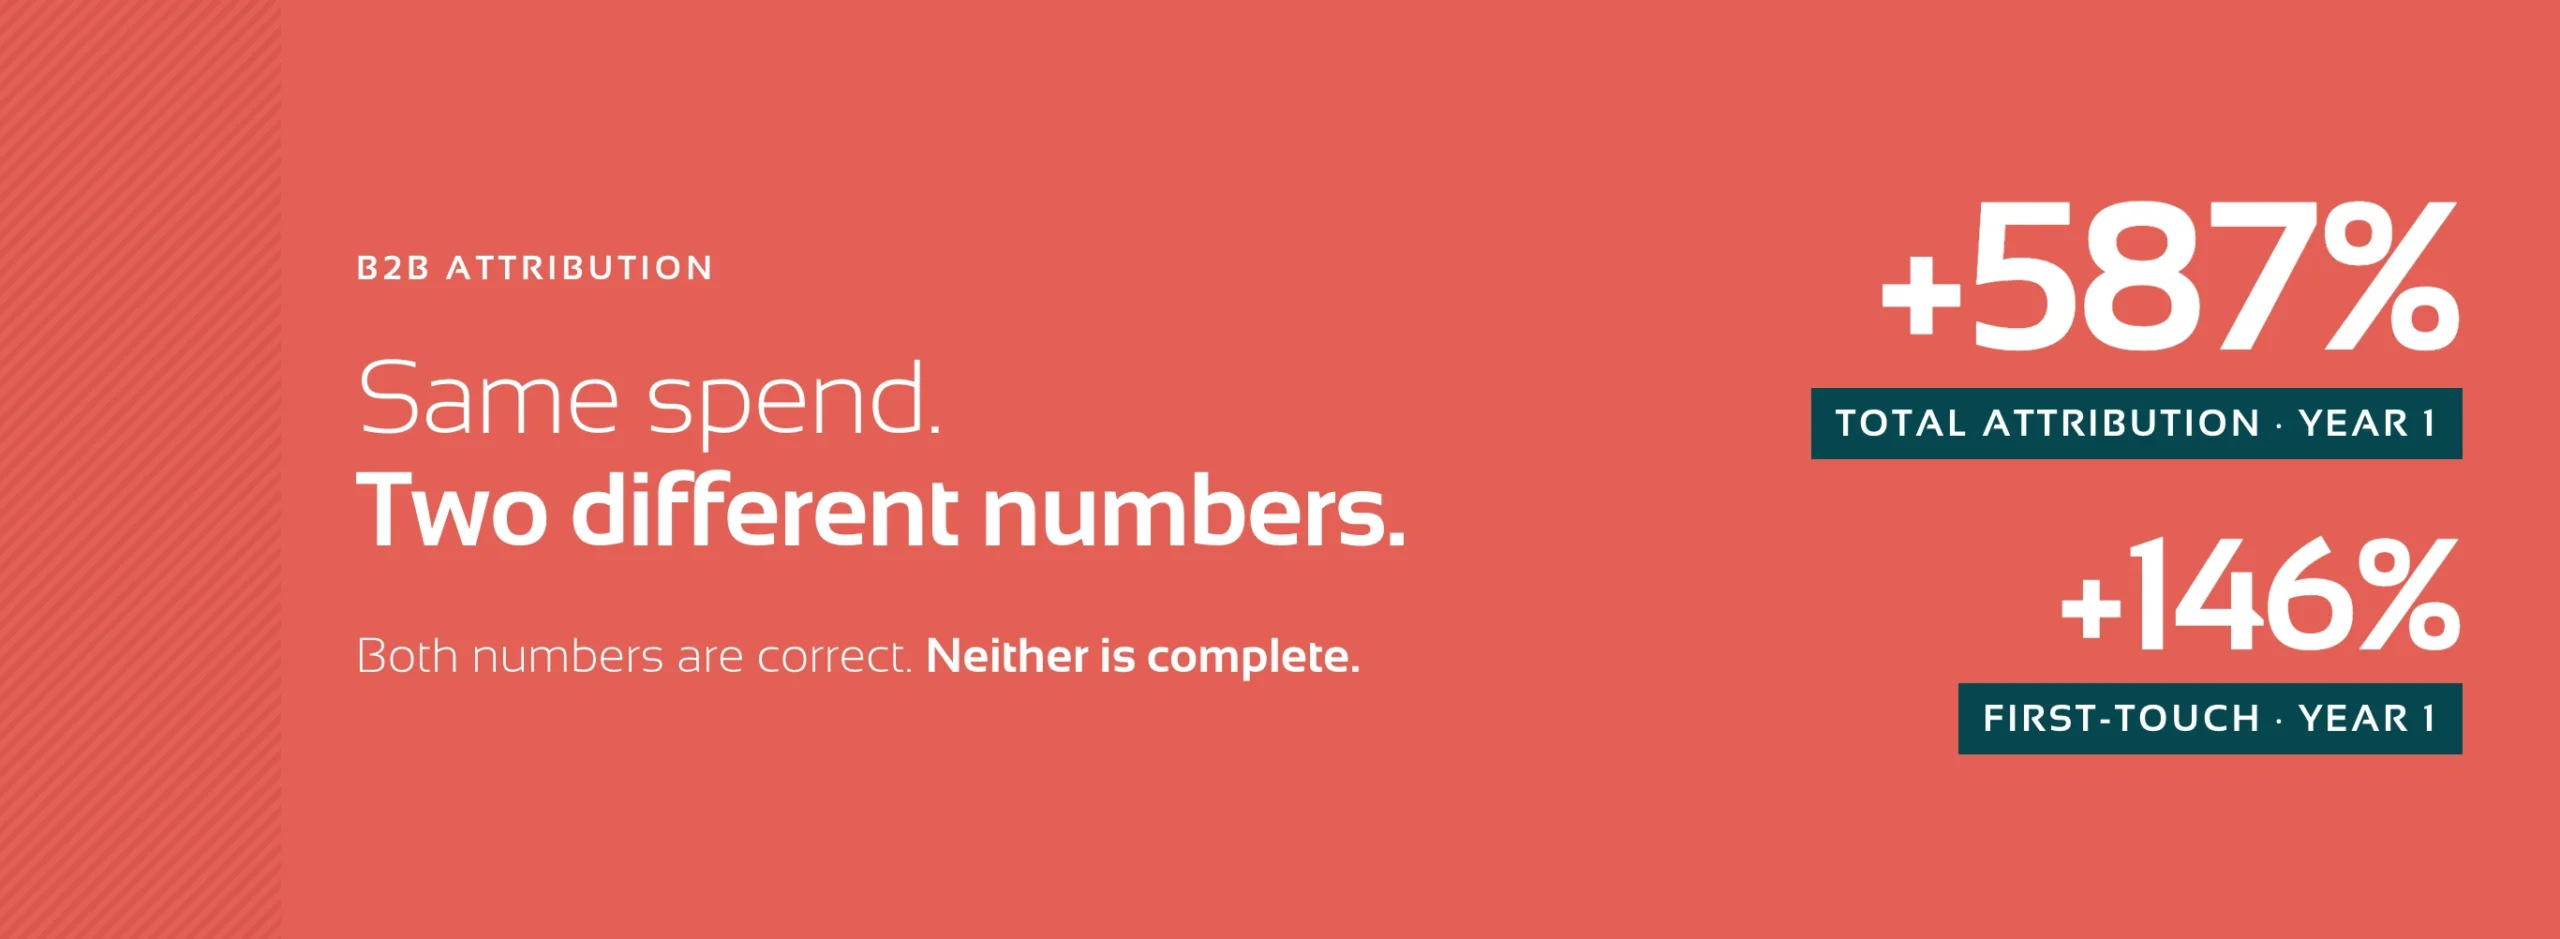
B2B Attribution: Why Your Paid Social Numbers Never Match Your CRM
Your ad platform and your CRM disagree because they divide credit differently. The platform credits every touchpoint that contributed to a deal, so one deal can appear in three channels’ numbers. Your CRM stamps one source on the contact and gives everything else zero. Same deals, same period, two different totals.
Neither system is broken. They are answering different questions, and most reporting arguments happen because nobody said which question was on the table. Below is the mechanism, the separate problem a long sales cycle adds on top of B2B attribution, and what the numbers look like when you publish both models instead of picking one.
Why do the two systems disagree?
Total or multi-touch attribution asks which channels contributed to a deal. First-touch asks which channel originated it. Run both against identical data and you get different numbers.
- Credit gets divided, and the rule for dividing it changes the answer. A deal touched by a prospecting ad, then a retargeting ad, then an email appears in all three channels’ numbers under total attribution. Under first-touch, the prospecting ad takes all of it and the other two get zero. Same deal, same week.
- Channel numbers can add up to more than your deal count. Total attribution credits every contributing touch, so summing channels double-counts deals that had more than one. That is the model working as designed. It measures contribution, not origination. It also means those totals never reconcile against a single-source count, and they are not supposed to.
- Retargeting is structurally invisible under first touch. Retargeting by definition never gets first touch. Under a first-touch model it produces almost nothing, which is how good retargeting budgets get cut.
- Deduplication fails across systems. The same person filling a form on two devices is one contact in HubSpot and often two conversions in the platform.
- The CRM is the only system that knows what closed. Ad platforms optimize toward the event you send them. If you only send form fills, you are optimizing toward form fills, not revenue.
That last point has grown teeth. Google Ads is automating more of the bidding decision, and its own guidance now pushes advertisers to feed better downstream signals rather than count leads inside the platform (Search Engine Journal, August 2026).
What a 4–6 month sales cycle adds on top
Credit allocation explains why two numbers differ. The sales cycle explains why both can be incomplete at once. These are separate problems and they need separate fixes.
The attribution window closes before the deal does. Meta and LinkedIn attribute within a set click and view window. A deal that closes in month five falls outside it. That conversion does not get divided differently. It never gets counted at all.
Spend and revenue land in different reporting periods. A campaign launched in March produces revenue in July. Judged in April it looks like a failure. Judged in August it looks like the best thing you ran. Same campaign, same data, different vantage point.
The buying committee outnumbers the contact record. Ops, IT, Finance, and an executive sponsor all touch the site. Your CRM attributes the deal to whichever one filled out a form. The other three are invisible, and they are often the reason the deal happened.
Targets set on a corrupted feed get worse, not louder. Google ended target overperformance on August 17, 2026: budget-limited campaigns on target CPA and target ROAS now deliver toward the stated target rather than beating it (Search Engine Journal, July 2026). If your target was set against bad conversion data, that change made the problem visible.
Publish both models, not the flattering one
The fix is not choosing a winner. It is reporting both and being explicit about which question each answers.
Here is what that looks like from a real engagement. In a B2B SaaS partnership covering organic and paid social with ROI tracked in HubSpot, we reported paid campaign ROI under two models across three windows:
| Window | Total attribution (all touchpoints) | First-touch attribution |
|---|---|---|
| Q1 | +402% | +26% |
| H1 | +282% | +10% |
| Year 1 | +587% | +146% prospecting +125% retargeting |
Read the first column and paid social looks transformative. Read the second and it looks modest. Both are accurate readings of the same spend. The first counts every touch that contributed. The second counts only the channel that started the journey, which is why prospecting and retargeting have to be reported separately under it.
Most agencies publish the +587% and leave the +10% out. Publishing the pair is what makes the number defensible when a CFO pushes on it. The full engagement, including +85% social follower growth in year one and a $12,600 retargeted inquiry, is in the B2B SaaS lead generation case study.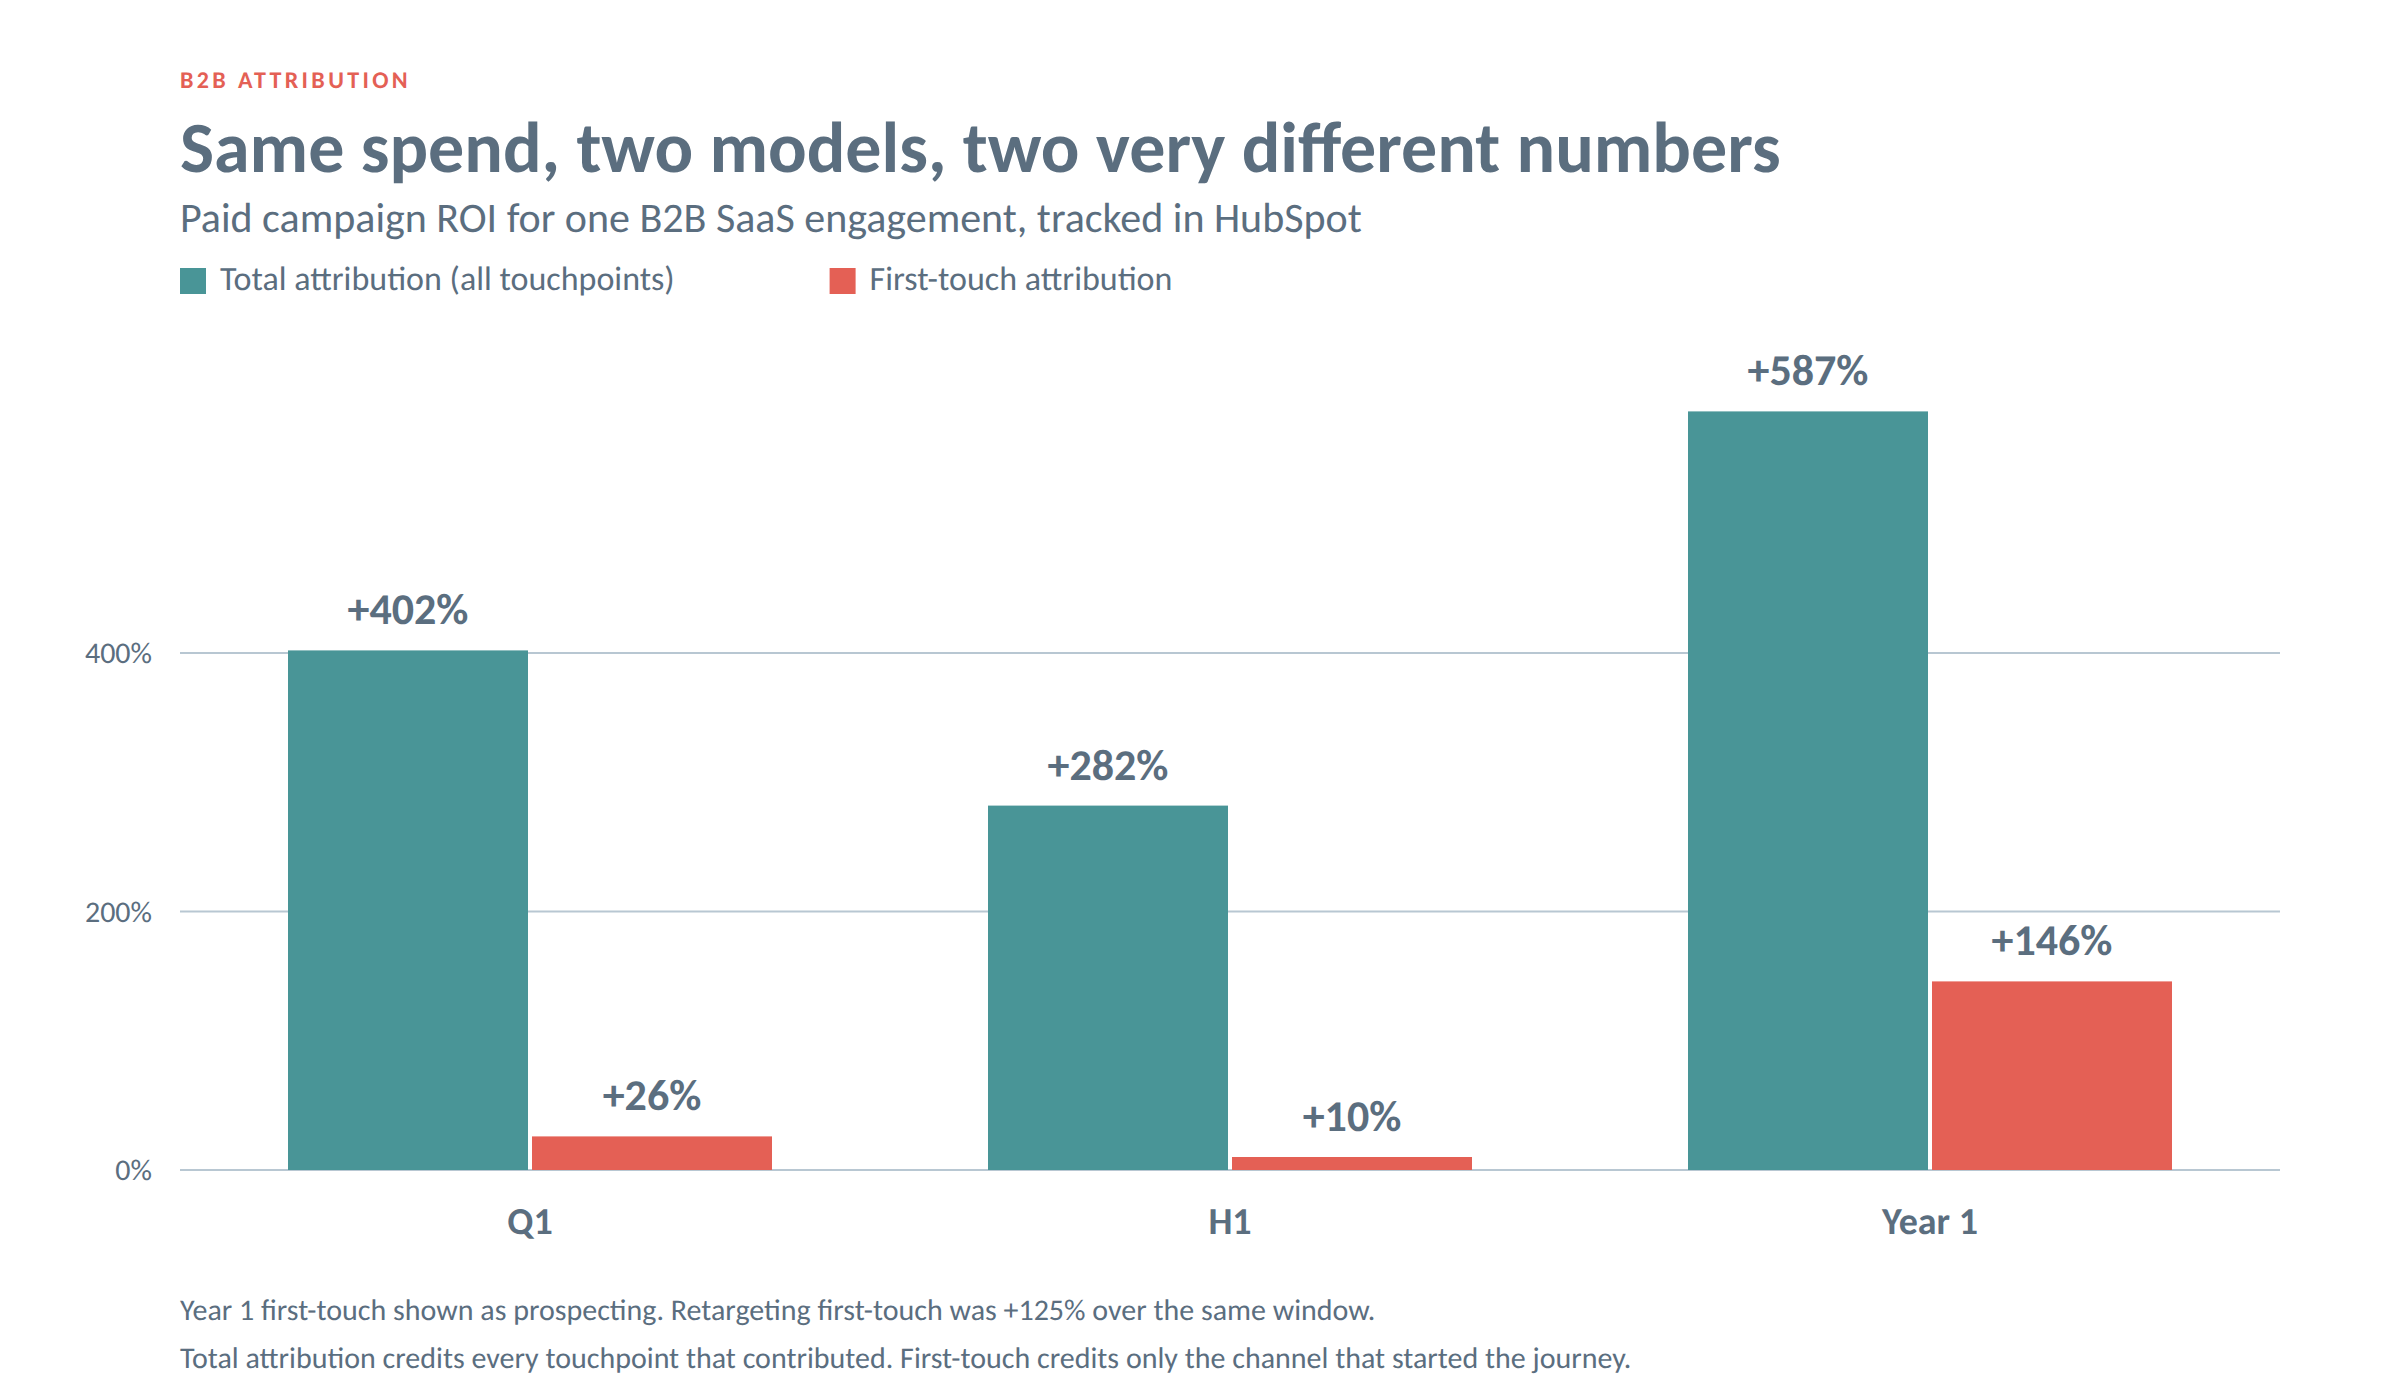
The five setup failures that corrupt the data before you model anything
Before debating attribution models, confirm the inputs. In our experience these five account for most of the disagreement that has nothing to do with the model:
- The pixel fires on the wrong event. Page-load instead of form-submit inflates conversions by counting every visitor to the thank-you page, including refreshes and direct traffic.
- Lead forms are not mapped to lifecycle stages. If a demo request and a content download both land as “new contact,” nothing downstream can separate intent.
- No exclusion of converted contacts. Existing customers and closed-won contacts keep seeing prospecting ads and keep re-converting, inflating both cost efficiency and lead volume.
- MQL and SQL are defined by marketing alone. If sales did not agree to the definition, the MQL → SQL rate measures a disagreement, not a funnel.
- Offline and sales-sourced revenue never returns to the platform. Without a closed-loop push, the algorithm optimizes forever toward the top of the funnel.
Setup errors that corrupt this feed are common and mostly silent (Search Engine Journal, August 2026). We audit all five before spend moves. It takes three days and it changes what every subsequent number means.
A three-tier reporting structure for long cycles
One report cannot serve a campaign manager and a CFO. Split it by cadence and by question.
Tier 1 · Platform and funnel efficiency (weekly). CTR, CPC, click-to-lead conversion rate, cost per lead, landing page conversion rate, and cost per qualified action such as a demo or meeting request. This tier answers: is the media working right now? It is where kill / keep / scale decisions get made.
Tier 2 · Quality and revenue alignment (bi-weekly to monthly). MEL (Marketing Engaged Lead) > MQL > SQL rates against definitions sales has signed off on, a documented sales feedback loop including disqualification reasons, and pipeline influenced, meetings set, and opportunities created where tracking allows. This tier answers: are the leads any good? Note the qualifier. Some of it will not be trackable, and saying so is better than inventing precision.
Tier 3 · 90-day outcomes (executive view). Which channels, industries, and offers create real sales conversations, and a repeatable spend and creative model for the next quarter. This tier answers the only question an executive asked: what do we do with next quarter’s budget?
The reporting chain that connects them is MQL → SQL → ARR. Tie every tier back to it and the conversation with finance changes from defending a channel to allocating a budget. That principle sits at the center of how we think about connected marketing systems, and it builds on the fundamentals in our guide to measuring marketing ROI.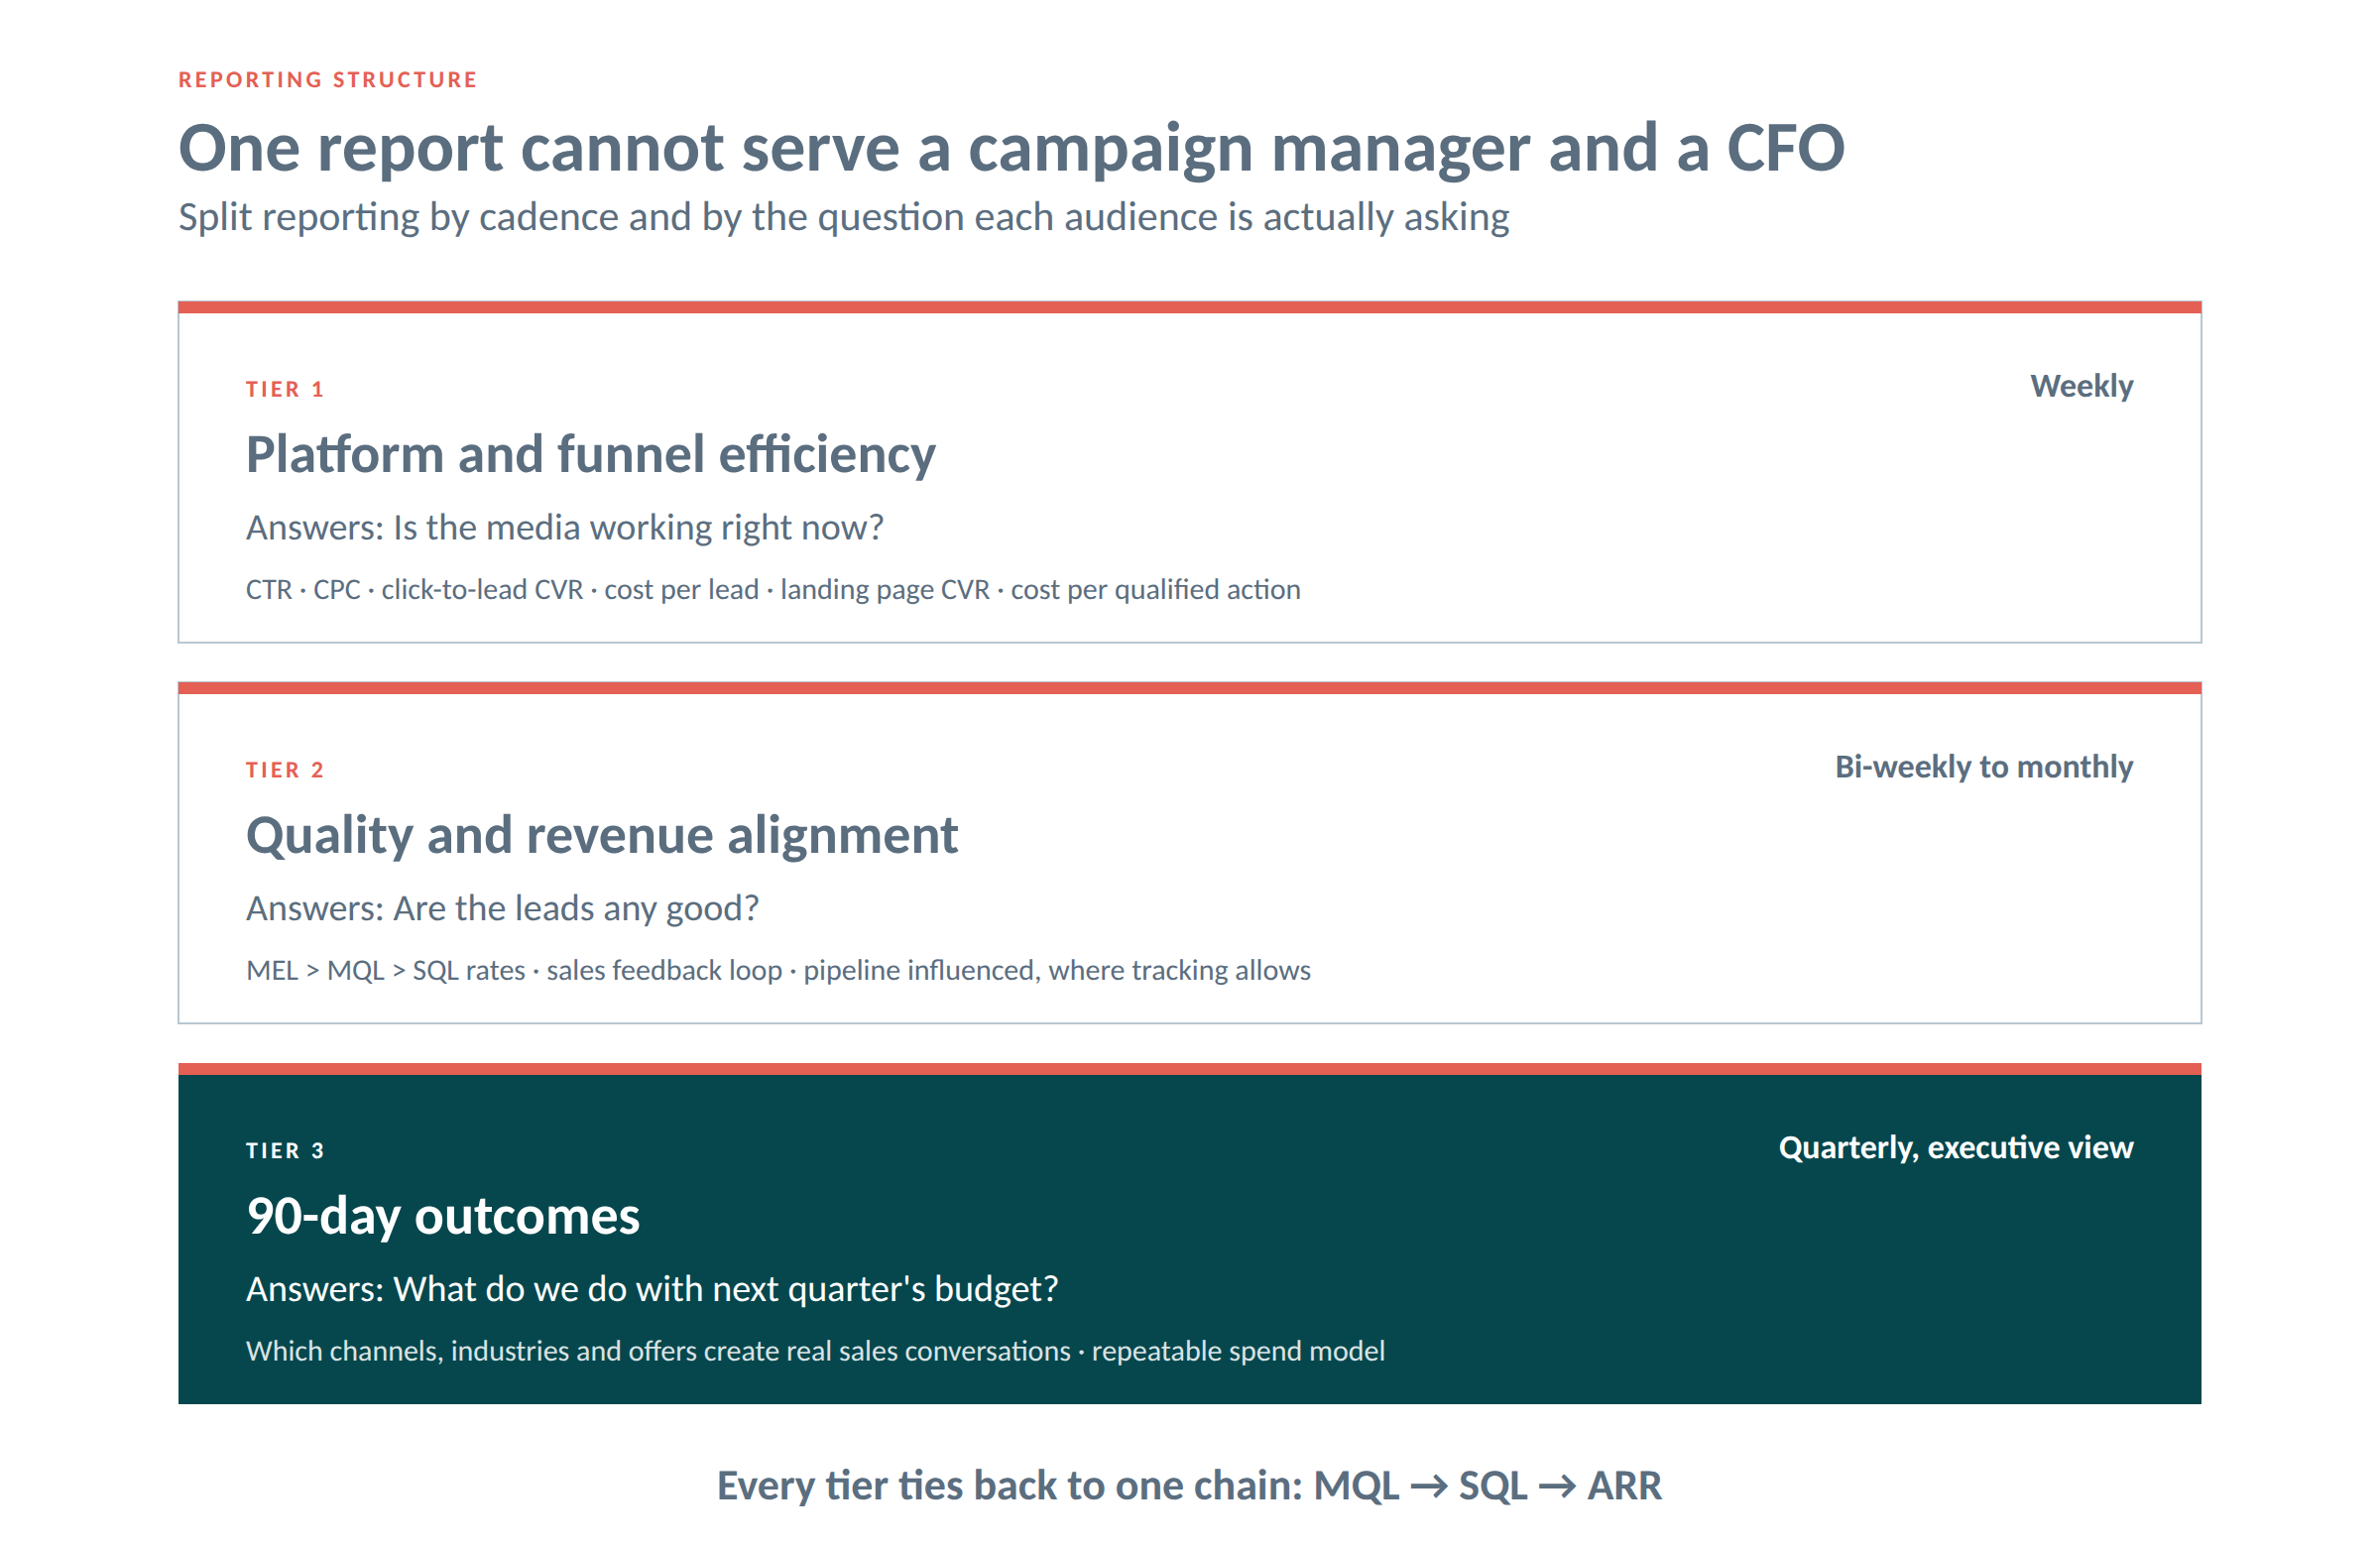
What to fix in the first 30 days
- Days 1–3. Audit HubSpot, GA, Google Ads, LinkedIn, and Meta. Verify every pixel fires on the right event and lead forms map to lifecycle stages.
- Days 4–14. Agree the attribution model with sales and finance before you agree the numbers. Write the MQL and SQL definitions together and get sign-off in writing. This is the step most teams skip and it is the one that determines whether tier 2 means anything. Our take on aligning sales and marketing covers how to run that conversation.
- Days 15–30. Turn on lead scoring, add converted-contact exclusions, and start reporting both attribution models side by side, each labeled with the question it answers.
When nothing is trackable, measure it a different way
Some of what works will never appear in a dashboard. Brand advertising is the clearest case, and the answer is not to stop measuring. It is to change instrument.
For Chesapeake Bank we ran a year-long brand awareness campaign and measured it with baseline and follow-up research from Alan Newman Research rather than platform data. Total aided awareness in the Greater Richmond region rose from 49% to 57%, an increase of 8 percentage points. Familiarity climbed from 13% to 21%, and the share of respondents who had never heard of the bank fell from 51% to 43%. No pixel could have reported any of that.
Long sales cycles need all three instruments. Platform data for the media, CRM data for the pipeline, and survey research for the demand that gets created before anyone searches.
FAQs | Frequently Asked Questions
Why don’t my Google Ads conversions match HubSpot?
Because they divide credit differently. Google credits the ad that drove the conversion inside its click and view window. HubSpot stamps a single original source on the contact and keeps it, giving every later touch zero. Add cross-device journeys and deduplication differences and the totals diverge further. Expect the numbers to differ. Investigate when the direction differs.
Should I use first-touch or multi-touch attribution for B2B?
Report both. First touch tells you which channel originated demand. Multi-touch or total attribution tells you which channels contributed to closing it. They answer different questions, so one number cannot replace the other. Picking one hides half the picture.
Why do my channel numbers add up to more than my total deals?
Because total or multi-touch attribution credits every touchpoint in a converting journey. One deal touched by three channels appears in all three channels’ numbers. That is the model measuring contribution rather than origination. It is not an error, but it does mean channel totals should never be summed and compared against deal count.
What should I report to a CFO?
Tier 3 only. Cost per qualified opportunity, pipeline influenced, MQL → SQL → ARR movement, and a spend recommendation for next quarter. Leave CTR and CPC in the weekly report where they belong.
Can I measure brand campaigns at all?
Yes, with survey research rather than platform data. Set a baseline before launch and re-field after. Report movement in percentage points on awareness, familiarity, and consideration.
Get a straight answer on your measurement
If your paid reporting and your CRM tell two different stories, the problem is usually in the setup rather than the model. We run a measurement audit across HubSpot, GA, Google Ads, LinkedIn, and Meta, and hand back what is broken, what it is costing you, and what to fix first.
See the receipts on our work, or give us a shout.