



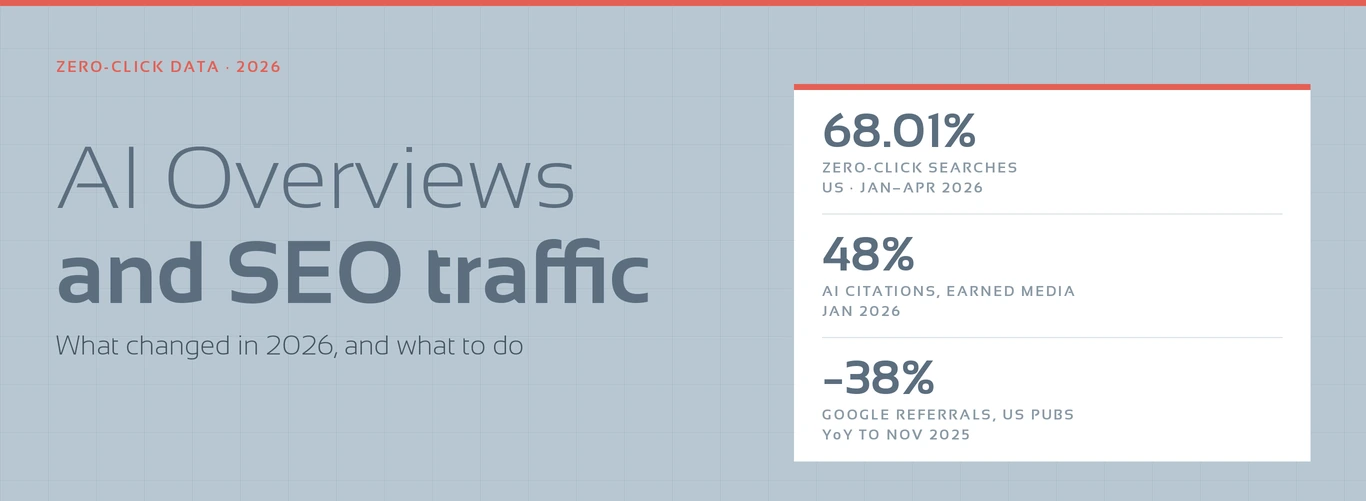
AI Overviews SEO traffic losses are real, and they are uneven. Google searches ended without a click 68.01% of the time in the US from January through April 2026, up from 60.45% in 2024 (SparkToro, via Search Engine Land, June 9, 2026, Similarweb panel data). Informational queries absorb most of the loss, while branded and late-stage queries barely move.
We published the first version of this post in May 2025. At the time the honest answer was “data suggests a continued decline.” There are numbers now, with dates and methods attached, and they change the advice.
How much SEO traffic have AI Overviews actually taken?
Zero-click & AI Overview data · 2026
These come from different windows and different methods, so read them together rather than picking the scariest one.
| Finding | Figure | Window and method |
|---|---|---|
| US Google searches ending without a click | 68.01% | January to April 2026, Similarweb desktop and mobile panel, analyzed by SparkToro |
| Change in zero-click rate | +7.56 pts | 2024 to 2026, same panel |
| Searches with at least one click | −9.51 pts | 2024 to 2026, same panel |
| AI Overviews appearance | 20%+ | Share of Google searches, reported alongside the same June 2026 analysis |
| CTR drop when an AI Overview is present | ~60% | Same analysis |
| Google organic referrals to US publishers | −38% | Year on year, year to November 2025, Chartbeat data in the Reuters Institute 2026 Trends report |
Two things worth holding onto. First, AI Mode is still small: 0.34% of searches transitioned into it over that same January to April 2026 window, even though Google has said AI Mode passed one billion monthly users. The pressure on your traffic today comes from AI Overviews sitting on the standard results page. A separate AI product is tomorrow’s problem. Second, the publisher numbers are worse than the all-sites numbers because publishers live on exactly the informational queries AI Overviews answer best. If your site is a B2B SaaS product site with twelve money pages and a blog, you are not a publisher, and you should not expect a publisher’s decline.
Why “traffic is down” is the wrong headline for a B2B marketer
Session counts were always a proxy. For a company with a four to six month sales cycle and a buying committee of Ops, IT, Finance and an exec sponsor, the blog’s job was to make the fourth stakeholder comfortable enough to stop blocking the deal.
That job still exists, it has just moved off your site. A buyer who reads your answer inside an AI Overview and then searches your brand name a week later has used your content. Your analytics will record that as a branded visit with no prior touch. The content did the work and the report gives the credit to direct traffic.
We wrote about this exact failure mode in why ad data never matches your CRM. The AI Overviews version is the same problem with a new cause: a touchpoint that influences the buyer and leaves no referrer.
So bring a sharper question to your next reporting meeting. Which queries lost traffic, and did we lose any pipeline along with them.
What AI engines actually cite, and why it is probably not your blog
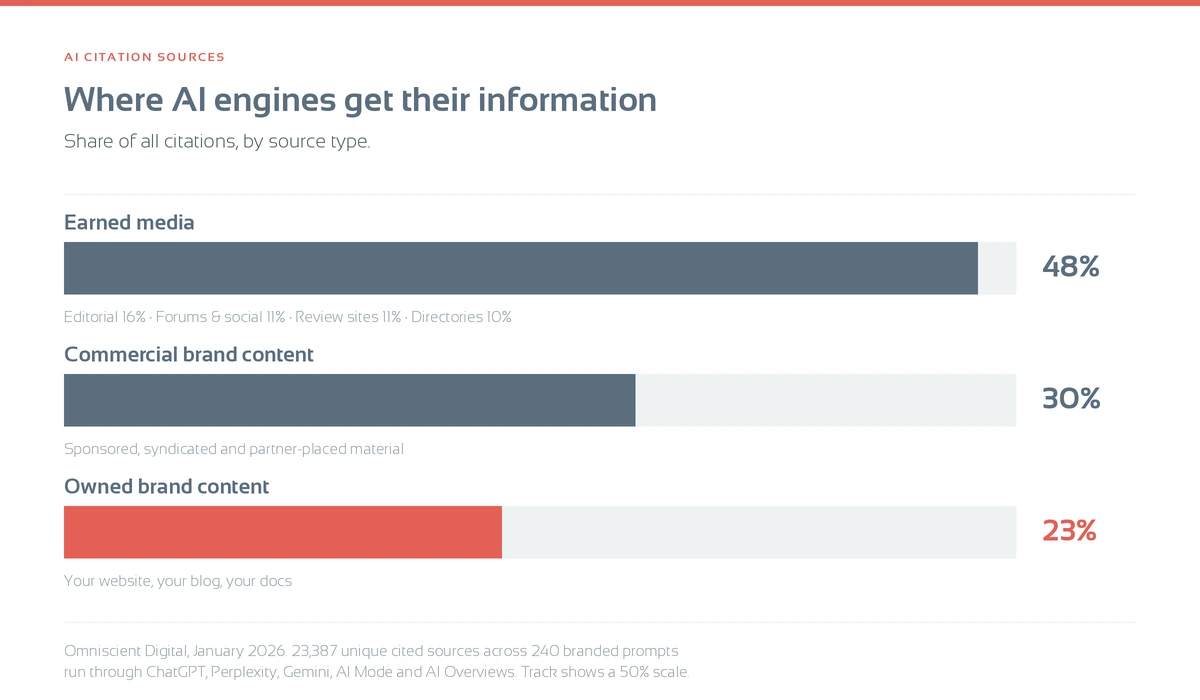
This is the single most useful number we found this year, and it cuts against most of the AEO advice in circulation.
Omniscient Digital analyzed 23,387 unique cited sources across 240 branded prompts run through ChatGPT, Perplexity, Gemini, AI Mode and AI Overviews, published January 8, 2026. The split:
- Earned media: 48% of all citations. Editorial and independent media 16%, forums and social 11%, review sites 11%, directories and reference sites 10%.
- Commercial brand content: 30%.
- Owned brand content: 23%.
And by buyer intent, the gap widens. Queries about customer reviews pulled 82% of their citations from earned media. Queries about functionality and integrations pulled 50% from owned content.
Read that as a content plan. Roughly a quarter of what an AI engine says about your company comes from pages you control. The rest comes from G2, from a trade publication, from a forum thread, from a comparison roundup someone else wrote. Writing more blog posts competes harder for the 23% and does nothing at all to the 48%.
Keep writing, but widen the definition of the work: the review profile, the analyst listing, the trade press mention and the integration partner’s directory page are all SEO now, and they belong in the same plan and the same budget line. Our guide to AEO and GEO covers the on-page half of this. The earned half is the half that is underfunded at almost every client we audit.
Four things we change when a client’s AI Overviews SEO traffic drops
This is the sequence we run. It takes about 30 days.
- Split the keyword set by intent before you panic. Pull every query the site ranks for and sort into informational, commercial comparison, and branded or transactional. Informational losses are expected and mostly acceptable. A loss on commercial comparison queries is a real problem and gets fixed first.
- Rebuild the top ten pages as extractable answers. A 40 to 60 word direct answer at the top, descriptive headings that read as questions, tables and numbered steps instead of long paragraphs, and every claim carrying its own number and date. AI engines lift self-contained blocks rather than well-argued 400-word sections.
- Fund earned placement like media, because it is media. Review site presence, analyst and directory listings, one or two trade placements a quarter, and partner or integration pages that name you. This is the 48% and it is the line item nobody has.
- Rewire the report before the next board meeting. Segment AI assistant referrers in GA4, track branded search volume as a demand signal rather than a vanity one, and add a self-reported “how did you hear about us” field to the demo form. None of these is precise, but together they cover a gap that attribution software cannot.
On that last point, we have watched the self-reported field outperform the model more than once. For one regional bank client, third-party brand research showed aided awareness moving from 49% to 57% and consideration climbing 22 percentage points over twelve months, while the same period’s click data showed almost nothing. The research was right and the clicks were wrong.
How to measure what is left
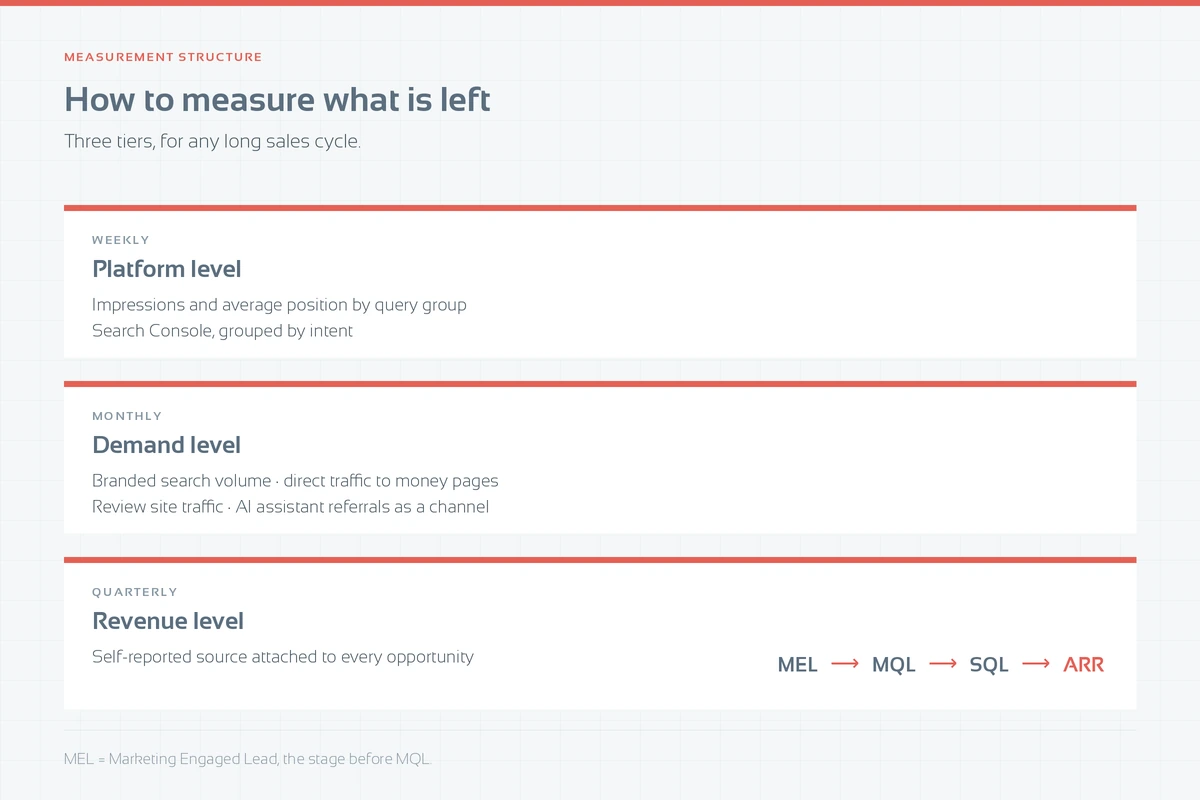
Three tiers, which is the structure we use for any long sales cycle.
Weekly, platform level. Impressions and average position by query group from Search Console. Position still matters inside an AI Overview, because the sources it cites skew toward pages already ranking.
Monthly, demand level. Branded search volume, direct traffic to money pages, review site traffic, and AI assistant referrals as a named channel group. Treat the trend, not the absolute number. AI referral volume is small at most B2B sites and a single month tells you nothing.
Quarterly, revenue level. Marketing Engaged Lead to MQL to SQL to ARR, with self-reported source attached. If organic sessions fell 25% and SQLs from organic held flat, what left was never going to buy, and the problem is in your report rather than your pipeline.
Our post on measuring marketing ROI walks the reporting spine in more detail, and how to build your data-driven digital marketing budget covers where the earned media line fits.
What has not changed
Ranking still matters, because AI Overviews draw from pages that already rank, and the technical fundamentals underneath that have not changed. Schema markup matters more than it did, since it is how a machine reads your page without guessing.
What has changed is the ratio. A content plan that was 90% owned blog posts and 10% everything else was defensible in 2023. Against a citation mix that is 48% earned, it is now a plan to be invisible in the places buyers are actually asking questions. We also wrote about the adjacent shift in how social media is reshaping how we search, which is the same pattern on a different surface.
FAQs
Do AI Overviews reduce SEO traffic for every site equally?
No. Publishers and informational sites lose the most. US publishers saw Google organic referrals fall 38% year on year in the year to November 2025 (Chartbeat, in the Reuters Institute 2026 Trends report). Sites weighted toward branded and transactional queries lose far less, because AI Overviews appear less often on those queries and answer them less completely.
Should we stop writing blog posts because of AI Overviews?
No. Owned content still accounts for 23% of AI citations and 50% of citations on functionality and integration queries (Omniscient Digital, January 2026). The change is in the mix. Fewer broad informational posts, more specific answer pages, and real budget behind earned placement.
How do we track whether AI search is sending us anything?
Create a channel group in GA4 for AI assistant referrers, watch it as a trend rather than a monthly number, and add a self-reported source field to your demo and contact forms. Most AI-influenced visits arrive with no referrer, so the self-reported field is doing the heavy lifting.
Is AI Mode a bigger threat than AI Overviews?
Not yet, by search volume. Only 0.34% of US Google searches transitioned into AI Mode between January and April 2026 (SparkToro, Similarweb panel data), while AI Overviews appeared on more than 20% of searches. Plan for AI Mode on a twelve-month horizon and fix for AI Overviews this quarter.
What is the first thing to fix?
Segment your queries by intent and find out whether you lost informational traffic or commercial traffic. Those are two different problems and only one of them is urgent.
give us a shout
If your organic traffic is down and nobody can tell you whether pipeline moved with it, that is a measurement question before it is an SEO question. We audit search visibility, AI citation presence and the reporting underneath both, then hand you the findings and the order to fix them in.
Give us a shout and we will show you what your numbers are actually saying.